Seplat Energy’s revenue grew 3.9% year-on-year to $840.7m
Seplat Energy Plc’s 3M 2026 performance was driven by pricing strategy with operations playing catch-up.
Headline revenue grew 3.9% year-on-year to $840.7mn and surged 53.1% quarter-on-quarter, but the quality of that growth is more nuanced, overlifts contributed 10.7%, implying an overlift-adjusted revenue of $748.7mn that came in marginally below Q1 2025. What stands out, however, is how effectively the Group positioned itself on pricing. Through its put-option hedge structure, Seplat retained full exposure to pricing upside, allowing it to translate geopolitical dislocations, specifically the Iran–US/Israel tensions into a 13%y/y increase in realised oil price to $86.2 per barrel from $76.4 per barrel in 2025,thereby partially offsetting the impact of weaker volumes.
On volumes, average daily working interest production declined slightly by 1.4%y/y to 129,841 barrels of oil
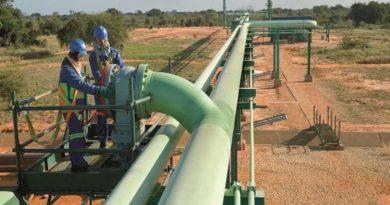
equivalent per day (boepd), largely reflecting the continued outage of the Yoho platform. Yet, sequential recovery was notable, with an 8.9%q/q increase driven by improved uptime and gains from the idle well restoration programme, which saw eight wells successfully brought back online. Onshore production fell by 9.9% y/y to 50,700 boepd, weighed down by a 38-day unplanned downtime on the Trans Forcados Pipeline (TFP). This was caused by an underwater leak requiring sectional replacement, before resuming on 24 March 2026. Offshore, however, provided a counterbalance, with production rising 4.9%y/y to 79,141 boepd. This was supported by stronger natural gas liquids output and incremental gas volumes, aided by the Inlet Gas Exchanger replacement at the East Area Project facility.
Cost of sales rose modestly by 3.1%y/y but declined 10.3%q/q, masking underlying pressure in production costs, which increased by 33.9%y/y to $17.1 per barrel of oil equivalent (boe) from $12.6 per boe in Q1 2025. This reflects both Yoho-related restoration expenses and elevated offshore activity levels. In contrast, non-production costs declined 11.9% to $270.6mn, benefiting from lower royalties and a reduced depletion, depreciation and amortisation charge. The royalty relief emphasizes the benefits of migrating onshore assets to the Petroleum Industry Act regime, while the softer depletion, depreciation and amortisation charge reflects reserve base revisions following the updated Competent Persons Report completed in Q4 2025.
Below the gross numbers level, cost discipline was more evident.
Operating expenses trended lower, with general and administrative expenses down 28.5%y/y and 41.8%q/q, driven by both cost reallocation of field-related expenses to cost of sales and sustained optimisation efforts across the Group. At $4.00 per boe, general and administrative costs came in below the 2026 guidance range of $4.50 to $5.00 per boe, highlighting management’s grip on controllable costs. Other losses more than doubled, largely reflecting the $92.0 million overlift position, while impairment charges increased significantly due to rising trade receivables from gas customers as well as other receivables. Fair value losses also widened, linked to higher hedge premium losses and revaluation losses on derivatives, indicating that the same hedging framework that delivered pricing upside also introduced accounting volatility.
On taxation, the transition to the Petroleum Industry Act terms continues to reshape the earnings profile. Income tax expense declined 30.7%y/y, bringing the effective tax rate down to 77.1% from 88.8% in Q1 2025. This reflects both the lower statutory rate of 60% under the Petroleum Industry Act for onshore assets (excluding Elcrest) compared to 85% under the Petroleum Profits Tax regime, and the recalibration of deferred tax recoverability at this reduced rate. While still elevated, the direction of travel is clearly supportive for net profitability over time.
Profit before tax declined 20.2%y/y to $165.6mn, weighed by the combined effect of lower onshore production following the TFP downtime, alongside higher finance costs, overlift movements, and impairments. Yet, profit after tax rose 62.7%y/y to $37.9mn, reflecting the impact of tax normalisation and cost controls below the operating line. Seplat demonstrated an ability to extract value from increased market pricing, stabilise operations sequentially, and leverage fiscal reforms, even as operational disruptions and balance sheet pressures tempered the overall earnings trajectory in the quarter.