
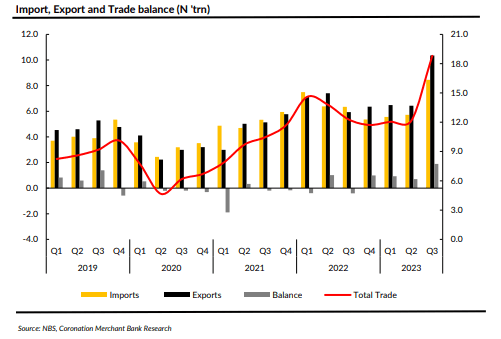
Nigeria Records Impressive Trade Surplus of N1.9 Trillion in Q3 ‘23
The National Bureau of Statistics (NBS) has released a report on international trade in goods. It indicates that the overall value of trade increased by +53.2% y/y to N18.8trn in Q3 ’23, compared to +17.2% y/y in Q3 ’22.
Comparatively speaking, it went up by 54.6%. Comparing the total export value to Q2’s N6.4trn, the value jumped by 60.8% on a quarterly basis to N10.3trn. This can be partially explained by the impact of the forex liberalization program, which caused the NGN/USD to depreciate by about 40%. From N5.7trn to N8.5bn, the import value grew by 47.7% on a quarterly basis. As a result, there was a N1.9 trillion surplus as opposed to the N708.9 billion surplus in Q2 of 23.
In Q3 of 2022, total trade as a proportion of nominal GDP was 9.4%, up from 6% in Q2 of the same year.
China accounted for 23.3% of all imports in Q3 ’23, with N1.97 trillion in imports coming from there, according to the NBS data. Next in line were the United States N502.9bn (5.9%), Malta N561.4bn (6.64%), India N802.1bn (9.5%), and Belgium N996.7bn (11.8%). In Q3 ’23, the combined share of these nations’ imports was 57.2%. The Economic Community of West African States (ECOWAS) accounted for 16.8% of all imports into Africa with N41 billion in imports.
The highest percentage of imports during the reviewed quarter (46.7%) were made up of manufactured items, whose import value increased significantly by 41.5% on a quarterly basis.
Closely behind, petroleum oil products made for 33.71% of imports and showed notable quarterly growth of 72.6%. The percentage of raw materials was 11.24%. On the other hand, solid minerals only made up 0.65% of the total. Following suit with a 7.61% share, agricultural goods saw a significant increase in value of 31.0% q/q.
In terms of exports, Spain ranked first with N1.27trn(12.31%), followed by India with N1.02trn(9.81%), the Netherlands with N988.6bn(9.56%), Indonesia (7.33%), France with 6.96%), and the United States with N5.88%).
In Q3 of ’23, these nations accounted for 52% of all exports.
In Q3 ’23, crude oil made up 82.5% of all exports; compared to the previous quarter, when its export value increased by +5% q/q, it increased by 70.5% to N8.5trn. According to different NBS figures, the average production of crude oil (including condensates) in Q3 was 1.57 million barrels per day, as opposed to 1.50 million barrels per day in Q2. This is less than Nigeria’s OPEC production quota of 1.7 million barrels per day.
Non-oil exports made up 17.5% of all exports, growing by 26.7% q/q to N1.81trn. In Q3 ’23, premium cocoa beans, chopped flowers, sesame seeds, soybeans, natural cocoa butter, soya beans, frozen shrimp and prawns, shelled cashew nuts, crude palm kernel oil, and ginger were among the primary export goods.
Nigeria sent commodities to ECOWAS valued at N711.7 billion, up from N439.6 billion in Q2 of 23. This accounted for 62.3% of all exports from Africa. In Q3 ’23, Apapa Port was the most often used port for exports. This port was used to export goods worth N9.9 trillion, or 95.8% of the total, out of the nation. Tin Can Island (N209.6 billion) and Port Harcourt (N137 billion) are two more frequently utilized ports.
Regional Trade / Global Focus
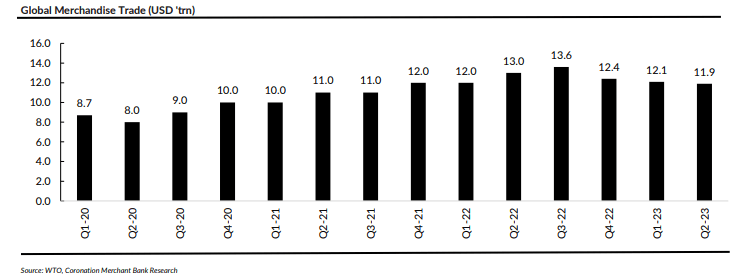
The World Trade Organization (WTO) reports that, in Q2’23, merchandise trade exports were US$11.9 trillion, down 7.6% year over year from USD$13.0 trillion in the same time in Q2’22. The overall merchandise trade exports decreased somewhat by -0.7% on a quarter-over-quarter basis.
A reduced global demand as a result of rising inflation and a disturbed supply chain are two factors contributing to the decline.
Wheat prices declined by -4.9% m/m as of the end of November 23 and closed at USD283.6/MT. Because of the good weather, wheat prices are still moderate. The price of maize likewise dropped, closing at USD211.3/MT, down -8.4% m/m. As of the end of November 23, the incidences of cocoa pod illnesses were the main cause of the +3.7% m/m increase in cocoa prices.
Moving on to China, trade exports rose 5.2%q/q to USD864bn in Q2 ’23 from USD821bn in Q1 ’23, notwithstanding the difficulties faced by the real estate industry. It can be observed that there has been a slight improvement in the Chinese manufacturing sector, as evidenced by the most recent PMI number (50.7 on November 23 compared to 49.5 in October 23).
In order to boost the economy, the People’s Bank of China has promised to maintain “accommodative” monetary policy.
Moving on to Africa, total merchandise trade fell to USD320.1 billion in Q2 ’23 from USD322.1 billion in Q1 ’23, a -0.6% q/q fall. It is noteworthy that in Q2 ’23, the region’s trade deficit was -USD29.2 billion. It is important to note that resource-rich economies like South Africa saw a trade surplus in Q3 of 2023, much like Nigeria. Conversely, in Q3 ’23, economies devoid of natural resources, such as Kenya and Egypt, reported trade deficits. According to data released by the United Nations Conference on Trade and Development, less than 15% of all exports from African nations in 2019 came from intra-African trade.
This implies that greater regional trade may have some advantages.
If the AfCFTA is implemented well, trade-driven growth may be stimulated by changing trade patterns to include less resource-oriented exports. But the region’s performance in putting trade agreements into practice is dismal, and there are still a lot of substantial regulatory gaps and non-tariff barriers. SOURCE: Coronation Merchant Bank